Development of analytical tools for digital mammography
Internship at GE Healthcare - March to August 2019
Summary
The objective was to design an algorithm to compute and display statistical metrics for pixel values within an elliptical region.
🔬 Non-Clinical Application
A valuable tool for medical physicists, who are responsible for ensuring the quality — particularly image quality — of medical imaging devices. Correlation tables exist between the average pixel values of a given region and the type of tissue present (e.g., cysts, tumors, fat, etc.).
🏥 Clinical Application
A more reliable tool than the radiologist’s eye for detecting subtle contrast areas, particularly in contrast-enhanced imaging (angiomammography), where even slight visual doubts can impact diagnosis.
Technical skills
The back-end was developed in C++, while the front-end was implemented using Qt/QML. Unit tests were written using GoogleTest, the C++ testing framework developed by Google.
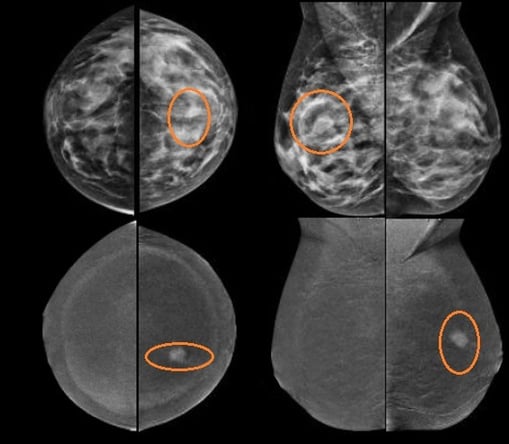
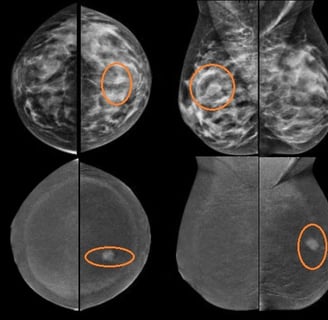
Mammography image with and without contrast product. The orange ellipses are traced by the user.
🧠 Process and outcomes
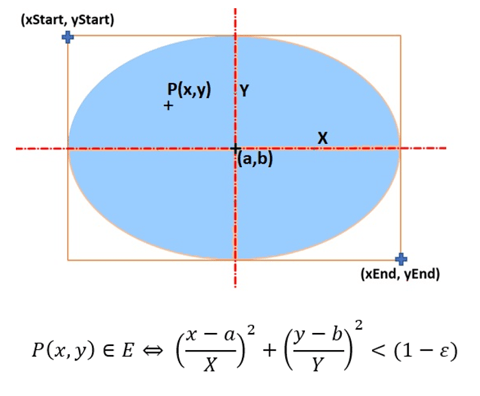
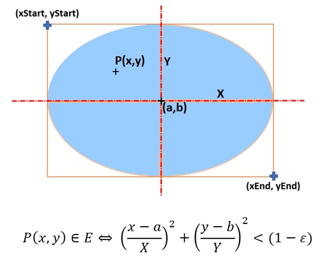
My initial idea was to start from the mathematical equation of an ellipse. We begin with an ellipse defined by two coordinates (top-left corner / bottom-right corner). A point (x,y)(x, y)(x,y) belongs to the ellipse if the corresponding mathematical formula is satisfied.
We iterate through all the pixels contained within the rectangle defined by the ellipse, and store each pixel value in an array. Finally, we compute the mean and the standard deviation.
Although this method is functional, it involves a significant amount of unnecessary computation. Given the symmetrical nature of an ellipse, the process can be optimized by evaluating only the top-left quadrant and extrapolating the remaining areas using axial symmetry. In the final optimization phase, I further refined the approach by scanning each row and, upon the first pixel satisfying the ellipse equation, assuming all subsequent pixels to the right also lie within the ellipse. This significantly reduces computation time while maintaining accuracy.
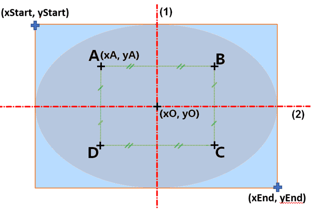
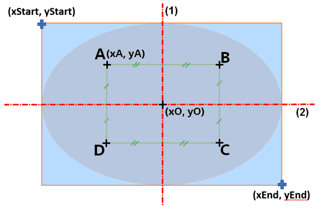

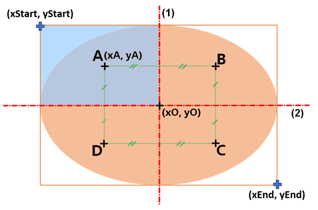
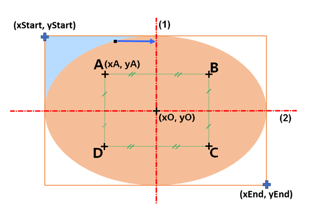
Progressive optimization steps. In each version, the blue region indicates the pixels involved in the computation.
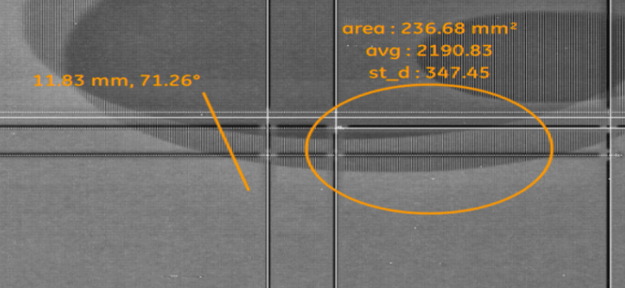
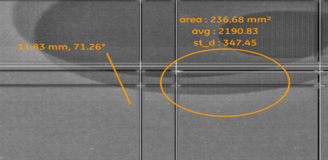
On a sample image, an ellipse is traced (a segment is also shown, but it is not part of the analysis). The results displayed include the area of the ellipse, the mean pixel value, and the standard deviation.
📊 Results and interpretation
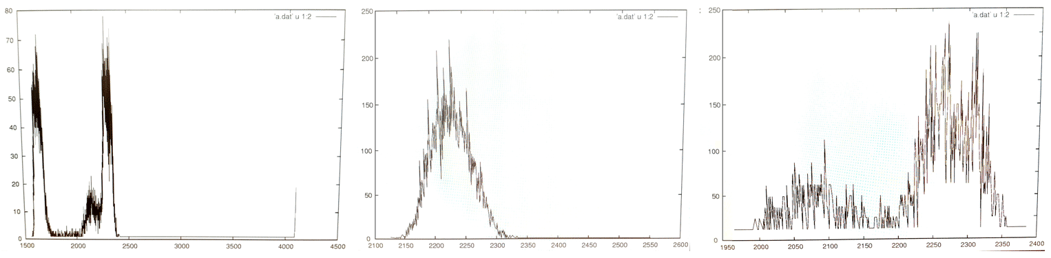
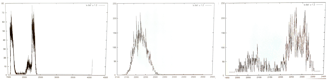
Left Histogram (wide spread, multiple peaks)
The values range from 1500 to 4500, with two main peaks.
This likely indicates the presence of multiple tissue types within the ellipse (e.g., a mix of fat and denser tissue like glandular tissue or a lesion).
Middle Histogram (sharp, bell-shaped curve)
This distribution is centered around 2200 and shows a clean, single peak.
It likely corresponds to a homogeneous region, possibly a single tissue type such as fat or a uniform cyst.
Right Histogram (noisy, irregular with multiple peaks)
This histogram is more irregular and spread out, though most values fall between 2200 and 2300.
It may correspond to a complex region, possibly including blood vessels or areas with contrast agent (as in contrast-enhanced imaging like angiomammography).
Histograms corresponding to three different elliptical regions.
The X-axis represents pixel intensity values, and the Y-axis indicates the number of pixels at each value.